Funliner: Handy plot tool
Table of Contents
Introduction
It's very command to need to parse a log file for numbers and then plot that data. Wouldn't it be nice to have a simple tool you could pipe numbers to for quick visualization?
Plot(.py)
Here is the code for our python program:
#!/usr/bin/env python3

import matplotlib.pyplot as plt
import sys

plt.plot([float(x) for x in sys.stdin],sys.argv[1] if len(sys.argv)>1 else '-')

plt.show()
You should chmod +x plot after saving this file
How to use it
Now suppose you had the following log file:
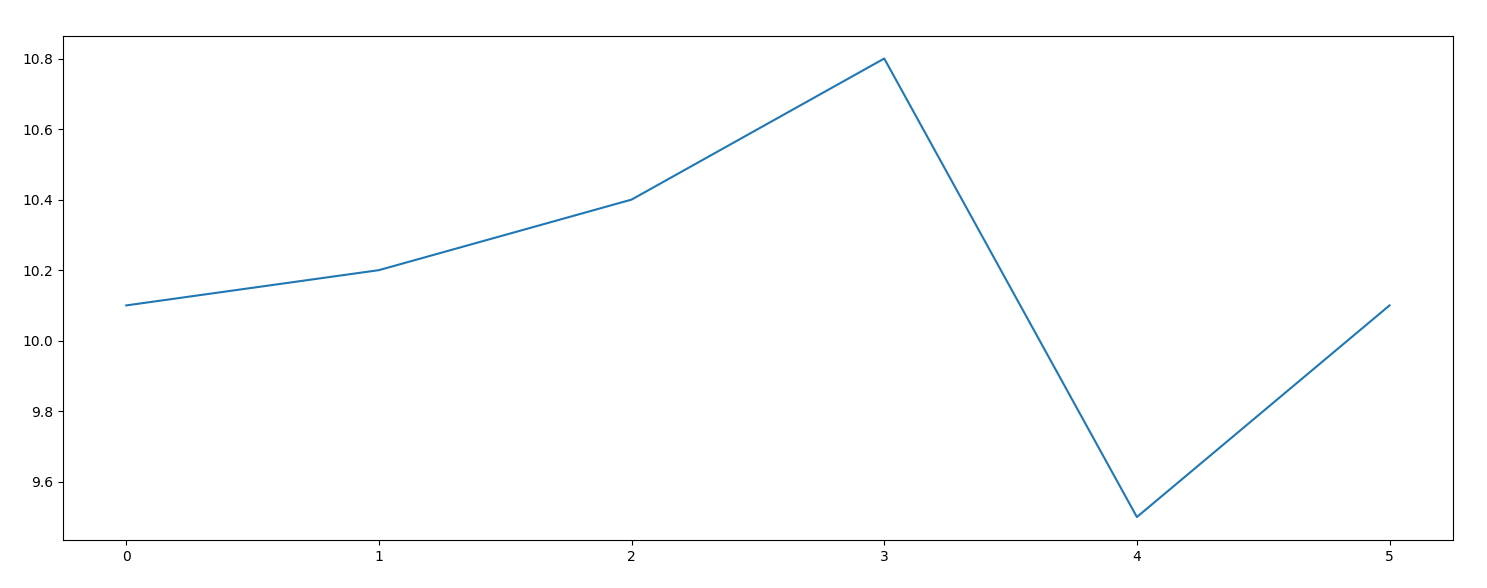
current error: 10.1 continuing
current error: 10.2 continuing
current error: 10.4 continuing
current error: 10.8 continuing
current error: 9.5 continuing
current error: 10.1 continuing
Let's assume it is saved as example.txt You could visualize this as follows:
$ sed -e 's/[^0-9.]*//g' example.txt | ./plot
And you'd get this output:
One more nice feature is that we can customize the plot style by passing arguments to plot: Try it out for yourself:
$ sed -e 's/[^0-9.]*//g' example.txt | ./plot o